Continuing from our last article ‘How To Read Stock Table’ and using AirAsia Bhd stock found in Bloomberg Market as a guideline, we’ve come to the second part and these are the following key indicators you’ll come across in a stock table:


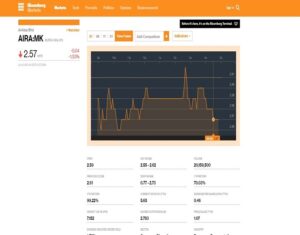
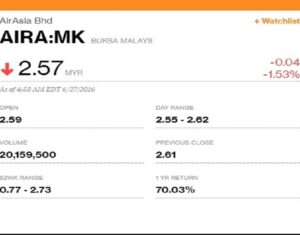
AirAsia Stock Table on 27 June 2016
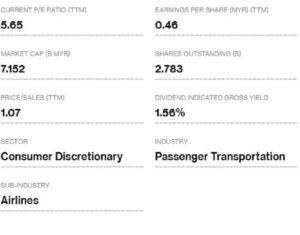
Current P/E Ratio (ttm): P/E referred to as Price per Earnings. This figure represents the ratio between the price of the stock and the earnings of the company.
What you need to about this figure is that the higher the P/E ratio, the more valuable the stock is to investors. The P/E indicates the amount an investor expects to invest in a company in order to receive one ringgit of that company’s earnings. AirAsia’s P/E ratio of 5.65 suggests that investors in the stock are willing to pay MYR5.65 for every MYR1 of earnings that AirAsia Bhd generates.
A high P/E suggests that investors are anticipating higher earnings growth in the future compared to companies with a lower P/E. A low P/E can indicate either that a company may currently be undervalued or that the company has been doing well relative to its past trends. Companies that are losing money do not have a P/E ratio and usually expresses it N/A.
Market Cap: This refers to market capitalization which is the total value of the company. Market cap is calculated by multiplying the total number of shares outstanding with the last price of the stock
2.783 BILLION (SHARES OUTSTANDING) x MYR 2.69 = MYR 7.152 BILLION (MARKET CAP)
Price/Sales (ttm): This ratio compares a company’s stock price to its revenues. The price-to-sales ratio is an indicator of the value placed on each Ringgit of a company’s revenues.
The lower this ratio is usually thought to be a better and an attractive investment since the investor is paying less for each unit of sales.
P/S varies greatly from sector to sector, so they are useful in comparing similar stocks within a sector or sub-sector.
Earnings per Share (ttm): You’ll most likely come cross this as EPS, which is the amount of earnings per outstanding share of a company’s stock.
Earnings per share serves as an indicator of a company’s profitability. When a company has high EPS, it also has a high stock price. Air Asia’s EPS is MYR 0.46.
When EPS is negative, it means that the company is losing money.
If you’re wondering what’s TTM, it’s an acronym that stands for ‘Trailing Twelve Month’ which means that the EPS being calculated is from the last 12 months.
Shares outstanding: This refers to the shares of a corporation that have been authorized, issued and purchased by and are held by all its shareholders. According to the stock table above, AirAsia Bhd’s outstanding shares are 2.783 billion.
Dividend indicated gross yield: You earn from stocks that pay dividends. The dividend rate describes how much cash a company returns to investors. The dividend yield rate is described in terms of percentage. The gross yield is the yield on an investment before the deduction of taxes and expenses.
This figure is often used to forecast a stock’s annual earnings investors. Thus, many stock tables include this feature to inform investors to the annual cash returns they might be able to expect.
Dividend yield can also be a sign of the company’s stability as profitable companies usually pay out dividends.
*Text by Chris Tan
Key Stock Table Indicators Explained
When learning how to read a stock table, it is important to understand the key indicators that provide insight into a company’s financial health and market value. These indicators help investors evaluate whether a stock is potentially overvalued, undervalued, or fairly priced.
Common stock table indicators include the price-to-earnings (P/E) ratio, market capitalization, earnings per share (EPS), price-to-sales ratio, and dividend yield. Each of these figures serves a specific purpose and should be analyzed together rather than in isolation.


